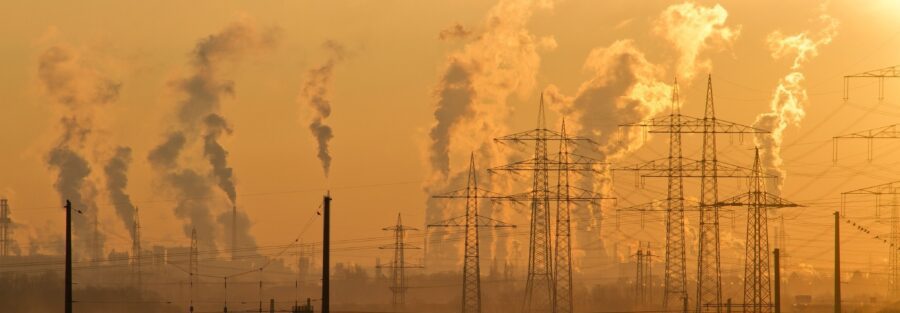
The heavy use of fossil fuels has resulted in greenhouse gas emissions which warms up the atmosphere. The result is climate change driven by global warming. A leading gas among Greenhouse gases is Carbon dioxide (CO2).
CO2 is not always produced artificially. Humans naturally exhale it and geographic
sources such as volcanoes continuously emit it for over millennia. Thus, there is no country in the world that does not emit CO2. Such natural emissions however, are low and have almost no impact on climate change. It is when human led manufacturing and consumption accelerates CO2 emission loads so much that CO2 becomes a greenhouse gas of concern.
Way back in 2013, Sri Lanka’s greenhouse gas outlook was positive. In a study by ADB, it was found that,
“..Sri Lanka has the potential to avoid emissions of over 5.6 million tons of carbon
dioxide equivalent in 2020 out of projected output of nearly 30 million tons by
adopting green power technologies and improving energy efficiency,” – Mahfuz
Ahmed, Principal Climate Change Specialist with ADB’s South Asia Department
in www.adb.org/news.
The positive outlook continued. Even year later, the country announced in September 2021 (at the United Nations International Energy Forum) that it “will cease building new coal-fired power plants and achieve net-zero carbon emissions by 2050.” Despite such display of good intentions, the country’s CO2 emission levels continued to increase.
According to ourworldindata.org, Sri Lanka’s CO₂ emissions Per capita (‘production- based’) did not show major changes until 1989.
“..Carbon dioxide emissions are those stemming from the burning of fossil fuels
and the manufacture of cement. They include carbon dioxide produced during
consumption of solid, liquid, and gas fuels and gas flaring..” – knoema.com
From 1950 to 1989 the number of production-based tonnes of CO₂ emitted in the
country showed only a slight increase (1950 at 1.63 million tonnes and 1989 at 3.45 million tonnes). However, a steady climb began in 1990 – from the year’s 3.83 million tonnes, and continued its increase, finally reaching 21.1 million tonnes in 2020. Therebyit shows that in the last three decades, Sri Lanka’s CO₂ level has surged by 450%. When it comes to Year on Year changes, the 2013 to 2016 period has been the most unpredictable.
What is the cumulative CO₂ emissions as of a given year? In 1980 it totaled to a 82.31 million tonnes and ten years later it totaled to a 121.82 million tonnes. In 2000 it climbed to 188.17 million tonnes and in 2010 totaled to a 306.4 million finally reaching a massive 500.28 million tonnes in 2020. In each decade, the decade to decade increase stayed between 30%-40%.
It is important to understand the mix in CO₂ emissions between production and
consumption-based emissions. Throughout decades, emissions from consumption always exceeded emissions from production. In 1990, 62% were from consumption while 38% emissions were from production. In 2000, 60% were from consumption while 40% emissions were from production. In 2010, 62% were from consumption while 38% came from production. In 2020, 59% were from consumption while 41% emissions were from production.


